Examples
This page serves as a short demonstration for some of the capabilities for preFoil.
The examples presented on this page can be found in examples/example_script.py of the preFoil repository.
Import Libraries
from prefoil import Airfoil, sampling
from prefoil.utils import readCoordFile
import matplotlib.pyplot as plt
These are the typical imports for using preFoil.
prefoil.airfoil.Airfoil and prefoil.utils.io.readCoordFile() are always needed to use preFoil.
sampling gives access some sampling functions that can be used to create surface meshes.
matplotlib is imported to visualize airfoils with built-in plotting tools, however this is not necessary for scripts that generate surface meshes.
Plotting an Airfoil
# Read the Coordinate file
filename = "../tests/airfoils/rae2822.dat"
coords = readCoordFile(filename)
airfoil = Airfoil(coords)
# Plot the airfoil
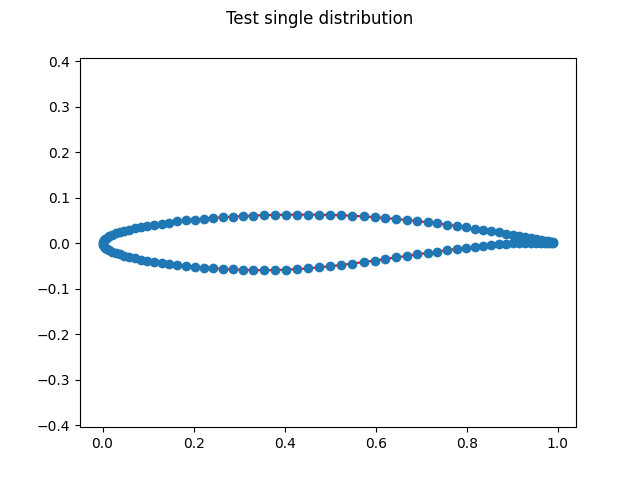
fig1 = airfoil.plot()
fig1.suptitle("Test single distribution")
plt.show()
preFoil performs most of its functionality through the use of the prefoil.airfoil.Airfoil class.
prefoil.utils.io.readCoordFile() returns a set of coordinates that can be used to initialize the prefoil.airfoil.Airfoil.
Then the airfoil can be visualized by calling prefoil.airfoil.Airfoil.plot(), which returns a matplotlib.pyplot.Figure object.
The resulting figure is shown below.
Sampling an Airfoil
Typically, when performing computational analysis on an airfoil, constant point spacing along the chord is wasteful. The leading and trailing edges of an airfoil have flow features defined by a much smaller length scale than the flow features near the mid-chord. A uniform grid fine enough to capture the flow features at the leading and trailing edges would use more points than necessary near the mid-chord, wasting computational resources. Grids can be generated with less cells that retain the same level of accuracy, by putting smaller cells near the ends of the airfoil and larger cells in the middle. Here, sampling an airfoil refers to the definition of points along the surface that make up the cells in this non-uniform fashion.
# Compare two different conical coefficient samplings
coords = airfoil.getSampledPts(50, spacingFunc=sampling.conical, func_args={"coeff": 1})
fig2 = airfoil.plot()
fig2.suptitle("coeff = 1")
coords2 = airfoil.getSampledPts(50, spacingFunc=sampling.conical, func_args={"coeff": 3})
fig3 = airfoil.plot()
fig3.suptitle("coeff = 3")
plt.show()
This block of codes plots two different point samplings along an airfoil.
After sampling an airfoil, the prefoil.airfoil.Airfoil.plot() function shows the most recently sampled points rather than the original.
Note
Sampling points does not change the underlying spline in the prefoil.airfoil.Airfoil. That is only changed by prefoil.airfoil.Airfoil.removeTE() or any of the geometry modification functions (prefoil.airfoil.Airfoil.scale(), prefoil.airfoil.Airfoil.rotate(), etc.).
Both sets of sampled points containing 50 points.
When using the prefoil.sampling.conical() sampling function, higher coefficents result in more nodes clustered near the ends of the airfoil.
# Sample with a bigeometric on the upper surface and eigth order polynomial on the lower surface
coords = airfoil.getSampledPts(
    50, spacingFunc=[sampling.bigeometric, sampling.polynomial], func_args=[{}, {"order": 8}]
)

# Plot the sample
fig4 = airfoil.plot()
fig4.suptitle("Test double distribution")
plt.show()
This shows a method for defining the sampling of both the upper and lower surfaces of the airfoil.
If a list containing two functions is passed into prefoil.airfoil.Airfoil.getSampledPts() then the first item defines the upper surface sampling function and the second item defines the lower surface sampling function.
Setting up an Optimization
# Write surface mesh
airfoil.writeCoords("rae2822", file_format="plot3d")

# Write a fitted FFD with 10 chordwise points
airfoil.generateFFD(10, "ffd")
preFoil serves two purposes when setting up an airfoil optimization.
The first is to generate the plot3d surface mesh.
It may seem counterintuitive to set up a 3D mesh for a 2D airfoil, but ADflow (the CFD solver used in MACH-Aero) uses one cell wide 3D meshes to compute 2D cases.
After generating the surface mesh a fitted FFD is generated to preform an optimization using prefoil.airfoil.Airfoil.generateFFD().
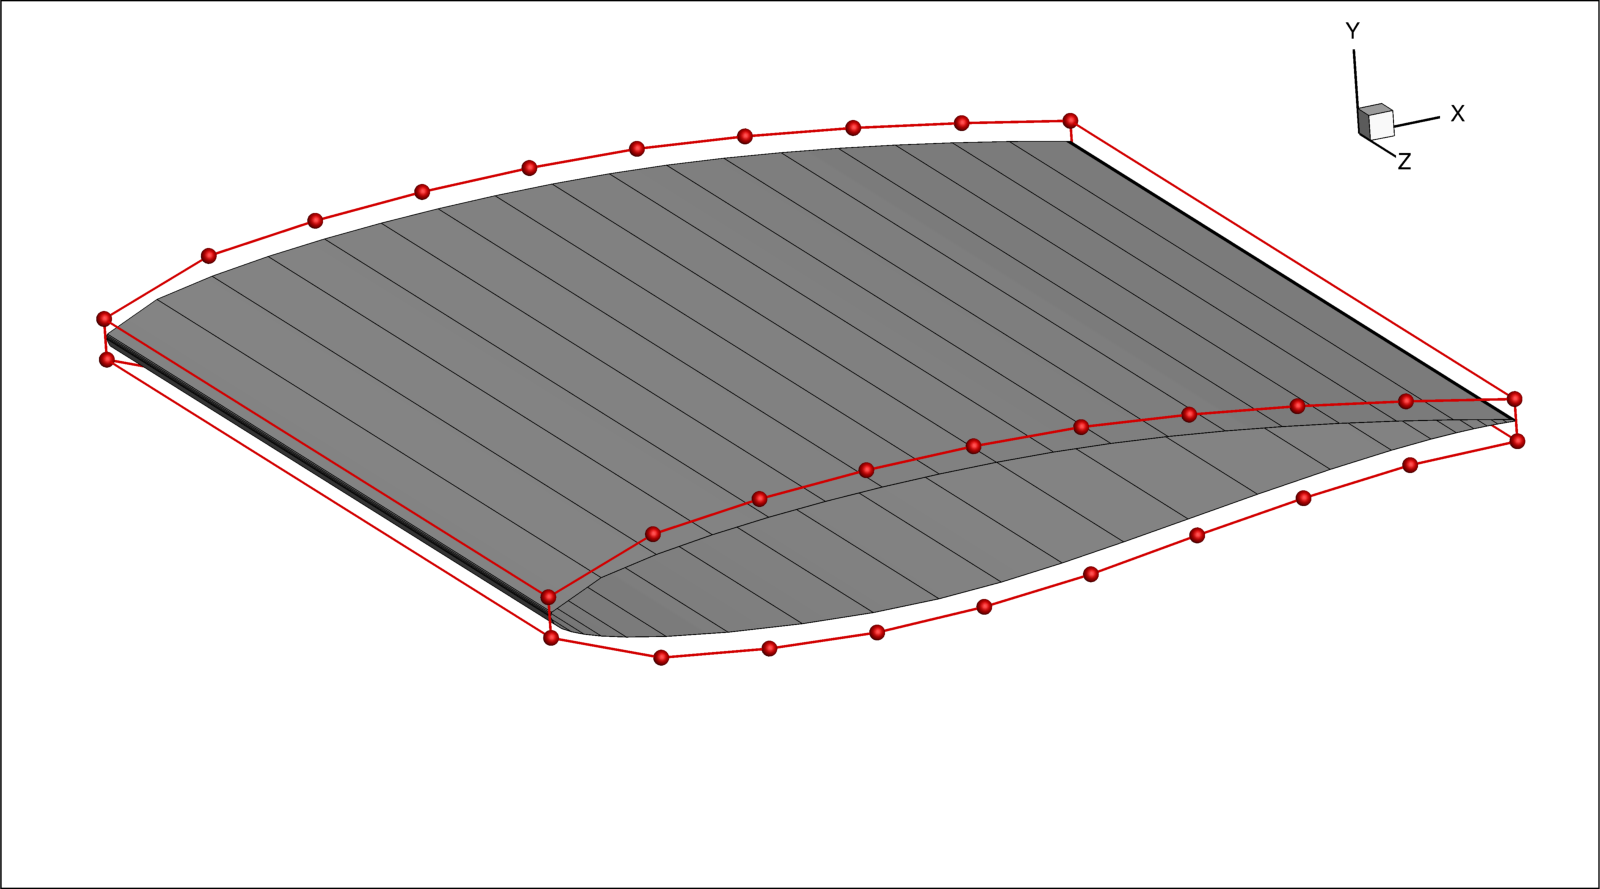
In this image, the one cell wide surface mesh can be seen on the airfoil surrounded by the FFD box highlighted in red. From here, an optimization can be preformed starting with pyHyp